
Last Updated 11/12/2017
The physics behind failure may not be your usual 4WD and camping topic but it’s an important concept to understand. Risk of failure is something to consider when building your vehicle and hitting the tracks. This article is not specifically targeted at off roading or vehicles. It describes more generally how failure operates so is of interest to anyone wanting to understand the mechanics of failure.
This article was conceived as an extension to the article on diesel performance chips where I discussed how a performance chip may impact reliability and risk of failure on an engine and drivetrain. Here I explain how failure works in more detail.
Probability and Continuity
Probability and continuity are the most important concepts to understand when it comes to failure. The finer details of fatigue, stress and cyclic loading are nice to know but probability and continuity are most important to understand how failure works. I’ll explain these concepts with an example.
Lets say we have a component and the component is designed to take a certain load. The manufacturer has specified that the component can take 20kg. You might say the breaking point of the component is 20kg. Usually this is interpreted as meaning the component will not fail with a load of less than 20kg and will fail with a load of more than 20kg. Put into a graph, it looks like this:

Loaded at less than 20kg, the component is safe and will not fail. Loaded to more than 20kg and it will break. Makes sense right? Load it by more than its rating and it will break. Too easy. The shape of the graph is called a step function. It jumps instantaneously from no failure to failure. In mathematics this sort of gap is called a jump discontinuity. There is no grey area. It simply fails when you exceed the specified limit. This is how many people understand failure to behave. It’s wrong!
Failure does not manifest as a step function. Actually it manifests as a probability distribution. Probability is the likelihood of an event occurring. Probabilities are given in values from 0 to 1, where 0 is 0% chance and 1 is 100% chance.
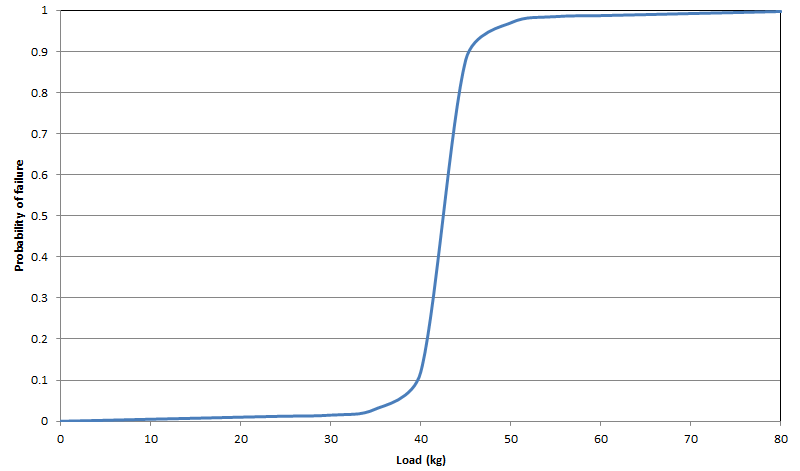
We can plot probability of failure vs load. Following with the example above, the graph will look something like this:

Now we are starting to see how failure actually works. The shape of the curve is a continuum. There are no jump discontinuities. There is no level below which the component has no chance of failing. It always has a chance of failing regardless of load and manufacturer specification. Any increase in load, from any starting load, will always yield an increased risk of failure. If you operate below the manufacturer’s specification of 20kg, there is still a risk of failure. If you operate at 10kg and then increase to 15kg then the probability of failure increases. If you increase load then probability of failure must increase. There is no alternative.
Can you see anything special about the manufacturer’s load rating of 20kg? Is there something obvious on the graph that changes after 20kg? The probability of failure increases as you exceed 20kg. But probability of failure increases with any load increase from any starting point. What is significant about 20kg that makes it the rating for this component?
There is nothing special about 20kg. Components do not have a fundamental rating. There is no inherent rating to any component. There is no fixed breaking point. So where does the 20kg rating come from? The manufacturer just makes it up!
Any component or equipment specification / rating is simply a point chosen on a probability distribution. There is nothing special about that point. The manufacturer chooses the specification as they see fit. Some things that the manufacturer would consider when determining the specification for a component would be:
– What is the typical load encountered whilst the component is in operation?
– What is the duty of the component? Duty means how long does the component need to operate for and what distribution of loads does it encounter whilst it’s operating. Does it need to run 24 hours a day? Is it usually lightly loaded or is it usually loaded at close to maximum capacity?
– What shock loads or short term overloads would typically be encountered during operation?
– What environment is the component operating in? Is it hot, corrosive, prone to vibration, likely to be mishandled or abused?
– What are the implications if a failure occurs? Will the operator lose money? Will other equipment be damaged? Will people be hurt or killed?
– What is a reasonable proportion of warranty claims vs items sold and how much of the sale price of the component covers for future warranties?
– What sort of reputation regarding reliability is the manufacturer seeking?
– Where does the product fit in the manufacturer’s range and what market are they targeting?
So the component has no fundamental rating. It’s just a number chosen by the manufacturer. Any particular component can have any rating depending on the reasoning above. Lets continue with our example of the component rated for 20kg. Lets assume the 20kg rating is for a commercial grade component, designed to be used often but not continuously. What if it is going to be used in an industrial plant where it will operate 24 hours a day, 7 days a week at full capacity and in a harsh environment? Then it might get a 10kg rating. What if it is to be used in a household application where it’s used rarely and in a gentle environment? Then it might get a 30kg rating. What if its failure will result in the death of many people? Then it might get a 1kg rating so that the probability of failure is so low it shouldn’t happen even in a hundred years. What if the component is made as a one off ploy to earn a lot of money and rip people off with no intention of contributing to a sustainable business? Then it might get a rating of 60kg. So in this example the same component can have a rating between 1kg and 60kg. Such a diverse range of ratings for exactly the same component.
What if the manufacturer de-rated the component to 10kg to protect the environment or adhere to some standard or regulation? Does that mean you can safely increase load? The reasoning for the rating is irrelevant. There is only one way to move on the failure probability curve if load is increased and that’s up.
What if the manufacturer wanted to be in the “heavy duty” or “high performance” market and so had two identical components with two different ratings? This is often used as evidence that you can increase load without increasing failure rate. However the component exposed to the heavier loads would experience a higher failure rate. There is no way to circumvent this. The manufacturer accepts the higher failure rate in order to compete in the heavy duty market.
This concept applies to everything. Whether it’s an engine, gearbox, tyres, a computer or a bucket. Rating is not fundamental to the item. There is nothing special about a component’s rating. It’s simply chosen according to the points listed above and the target probability of failure. Failure manifests as a continuous probability distribution. Continuous means no step function. It means no discontinuities in the probability function. This is the most important concept to understand when it comes to failure.
Back to the example of the 20kg rated component. Since there’s a good chance the component can take more than 20kg without breaking, does that mean if you overload it you can pursue the manufacturer for warranty? Can you argue that it shouldn’t have broken regardless of the overload? Of course not. A cutoff needs to be defined otherwise this argument could go on to infinity. The manufacturer defines the cutoff and you agree to that cutoff when you buy the component.
Fatigue
Why is failure the way it is? Because each time you operate any equipment or component it wears out a little bit. No matter how it was designed or how much it’s been over-engineered or how much it’s been de-rated or how lightly you load it, it still wears out to a certain degree. This wear is random but increases in magnitude as load is increased. The wear accumulates until eventually a failure occurs. The wear is called fatigue.
Fatigue occurs whenever anything is loaded. Flaws and defects in the material act as stress concentrators. The flaws and defects are microscopic or even submicroscopic, occurring at an atomic level, and are randomly distributed throughout all materials. The random nature of these flaws and defects is what gives rise to the probabilistic nature of failure. Tiny cracks will form at the stress concentrators whenever load is applied. The cracks grow until they reach a critical size after which the component fails. Variations in the manufacturing process add to the randomness of how fatigue accumulates into failure. For example fatigue occurring in a weak weld will cause a premature failure.
Other Causes of Failure
Apart from traditional fatigue, there are other ways that things wear out which contribute to failure:
– Oxidation / rusting will weaken a component.
– Corrosion / chemical degradation will weaken a component. This may be for example acidic byproducts of combustion that accumulate in engine oil and cause engine corrosion. It may be water causing hyrolysis within a polymer plastic. It may be tiny quantities of ozone in the air causing slow degradation of rubber.
– Heat and radiation degrades materials. For example heat may change the lattice arrangement in an alloy, making it weaker. Heat may cause a mechanical system to warp slightly out of alignment or create internal stresses due to uneven heating, accelerating wear. Heat causes diffusion of semiconductor doping within electronics, causing the electronics to eventually fail. UV light and heat changes the structure of plastics and polymers, degrading it and making it weaker.
– Physical wear. Whenever something is moving it wears out. Molecules get worn away by friction. No amount of design or lubrication can completely eliminate physical wear.
So everything has a finite life and everything will eventually fail from a combination of fatigue and other processes. No matter how a component is designed, specified or utilized, it will always eventually fail. Probability of failure will always increase when load is increased.
Fatigue Limit
Some materials, such as certain alloys of iron and titanium, have a fatigue limit – a level of stress below which no fatigue occurs. Theoretically this means components could be designed to never fail due to fatigue. However the component will still wear out and fail due to the other causes of failure as identified in the section above. Additionally fatigue may still occur due to unusual shock loads / overloads exceeding the fatigue limit. Fatigue can occur despite the specified rating being below the fatigue limit. As the fatigue due to shock loads accumulates the component will weaken and no longer operate within the fatigue limit. Eventually a fatigue failure will occur.
Very Simple Components
There are values of strength that are defined for certain materials, such as ultimate tensile strength, compressive strength and yield strength, which implies failure works as a step function. For example, exceed the ultimate tensile strength of a material under tension and it will break. Actually the failure still occurs over a probability distribution. There’s still variations that occur due to manufacturing. There’s still random defects located throughout the material. The probability distribution will look something like in the figure below.
A limit such as ultimate tensile strength, compressive strength, yield strength, or any other material limit, is defined per cross sectional unit area of a uniform rod made from the material in question. Such a simple component has a more predictable way of failing. The probability distribution gets compressed due to that very simple failure mode. So in the chart above you might say the strength limit is 40kg. Below 40kg the probability of failure is very low. Above 40kg and the probability of failure rapidly accelerates. It gives the impression of a step function because the extremely simple way in which it can fail gives a more predictable failure point. It is still a probability distribution but the shape is much sharper, more like a step function. This is a result of the very simple structure of the component being tested. As you add complexity, the ways that it can fail increases. All these failure modes get superimposed on top of each other which spreads out the probability distribution curve to look more like the probability curve at the start of this article.
Failure and Cyclic Loading: S-N Curve
The graph above of probability of failure vs load is simplistic. It does not consider cyclic loading. Cyclic loading is the repetitive loading and unloading of any material or component. For example, in an engine a cycle may be defined as one revolution. Or it could be defined as the completion of the combustion cycle (4 revolutions in a 4 stroke engine). It could be the cycling that occurs when driving on a corrugated dirt track. Each cycle causes some level of fatigue. The higher the load, the greater the fatigue per cycle. The life of the component is dictated both by the magnitude of the load and the number of load cycles.
In materials science, an S-N curve is used to represent the relationship between load and number of cycles. S is for stress and N for number of cycles. It is a graph of magnitude of cyclic stress vs number of cycles to failure. Number of cycles is usually on a logarithmic scale to better illustrate the relationship over a vast cycle range.
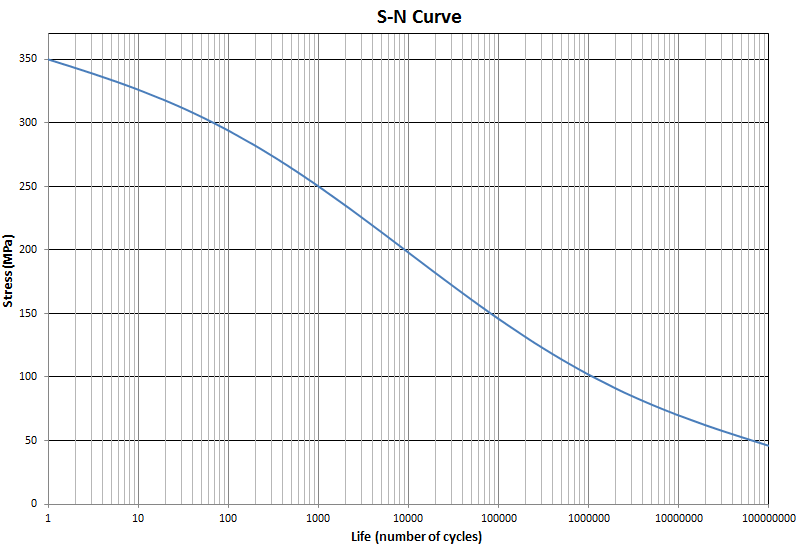 The S-N curve tells us how many cycles we can expect at a particular load before failure occurs. So, for example, a load of 100MPa will yield about 1,000,000 cycles before the component fails. If the stress is doubled to 200MPa the number of cycles reduces to about 10,000. So doubling the load yields a disproportionate reduction in cycle life. In this case doubling the load reduces the number of cycles by a factor of 100. This is an important observation. Small increases in load can have a large detrimental effect on the lifetime of a component.
Note the continuous nature of the curve. Any increase in stress from any starting point will always yield a shorter lifetime and fewer cycles before failure. There is no way to increase load without reducing the lifetime. There is no fundamental stress level below which the component is safe. There is no obvious part of the curve where one could define as the rating of the component. Rating depends on how many cycles the component is required to last and how much load it has to endure.
The S-N curve is simplistic. It provides an expected value for number of cycles at a specified level of stress. Each level of stress actually yields a complete probability distribution for failure. So at a stress of 100MPa, on average the number of cycles would be around 1,000,000. But there is still a chance that the lifetime could be more or less than the expected value. To describe this adequately requires a 3 dimensional graph: an S-N-P curve where the P is for probability. This plots stress vs number of cycles as a function of probability of failure.
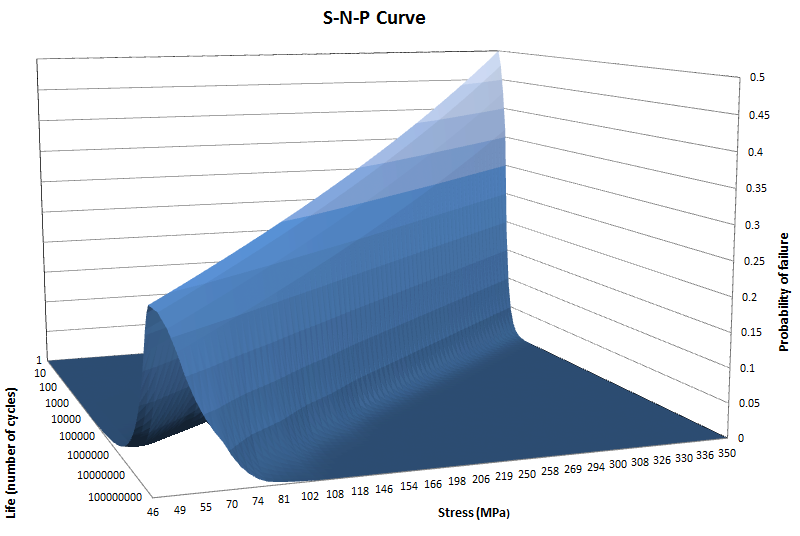
So this graph tells us, for example, that at a stress of 200MPa, it’s very unlikely to get a failure within 1,000 cycles. It’s also very unlikely to last more than say 100,000 cycles. The peak in the probability is around 10,000 cycles. This is the expected number of cycles at 200MPa.
Failure vs Time: Bathtub Curve
Another useful way to look at failure is failure rate vs time. With some equipment, it’s difficult to define a cycle – for example a network switch or a computer processor. Whether cycles can be easily defined or not, a failure rate vs time curve is a useful illustration of how failure develops with time. It’s called a bathtub curve because its shape is similar to a bathtub in cross section.

The actual observed failure rate is the green line, the shape of which looks like a bathtub in cross section. It is the sum of three components:
– Early failure which decreases with time. These failures may be due to variations in tolerances, manufacturing defects, handling issues or installation errors.
– Constant failure which is independent of time. It is random.
– Wear out failure which increases with time.
The failure rate of equipment like network switches is still effected by various factors. For example higher temperatures will increase failure rate. Higher voltages will also increase failure rate. So you could say the network switch is “loaded” by temperature and voltage. A 3D curve, similar to the S-N-P curve, could be produced to demonstrate the effect of load against failure rate and time. However I’ve had enough of making 3D graphs so you wont see one here. The theory of continuity still holds true though. Any increase in load, from any starting load, will increase the failure rate.
How to Ensure Reliability
So if every component and every piece of equipment is always at constant risk of failure, how do we make stuff reliable? How do we ensure life critical systems do not fail? For example, how do we ensure planes don’t crash due to mechanical / electrical failure? There’s a few things that can be done:
Keep it Simple: Simplicity makes failure more predictable. This means something simple can be designed with a high certainty of being reliable. Simple things are also easier to inspect and maintain. This method is used for stuff like bridges. Or the chassis of a truck.
Operate in a very low failure probability zone: This means loading a component so that it has a very large mean time between failure or a very high expected number of cycles. Following with the example at the start of this article, you would pick a very low rating – say 1kg. This may yield a mean time between failure of perhaps a few hundred years. This means on average the component will last a few hundred years. This does not guarantee that failure won’t occur prematurely, but it makes the probability of premature failure extremely small.
Maintenance: Replace components under scheduled maintenance at an interval well below the mean time between failure or expected number of cycles. This means components are replaced before they have a chance to develop a significant risk of failure.
Inspection: Check components for early signs of premature failure, such as fatigue cracks. If problems are detected have the components replaced.
Redundancy: Design the system so that the failure of one component does not result in failure of the entire system. For example, large airliners have two engines. The probability of two failures at the same time is very low because each failure is an independent event.
Implications
How does all this effect you and the stuff you use? Here are some key points:
– Everything fails eventually.
– Isolated experiences of failure or no failure do not adequately describe a component’s failure rate. An isolated item can fail prematurely based purely on probability even if the item was not abused or overloaded. Similarly an item can be overloaded and still last a long time. However, on average, increasing load always increases failure rate.
– Failure has many contributing factors that accumulate over time in addition to the conditions that were present at the time of failure.
– If you’re using something then it’s wearing out. The wear accumulates and will be contributing to a future failure.
– You can’t get more out of something without increasing the probability of failure. Using something more often or increasing the load will always increase the probability of failure. Specification or load rating is irrelevant.
– Small increases in load can vastly increase the probability of failure and severely reduce average lifetime.
– Exceeding a load rating does not guarantee failure, but the probability of failure increases, the same as any increase in load from any starting point. The load rating is not special.
Failure is a game of risk and probability just like many things in life. Whether it’s investing in the share market, speeding in a vehicle, going bungee jumping, smoking cigarettes or drinking alcohol – it’s all the same idea. How much alcohol can you drink until you get cirrhosis? How fast can you drive until you crash? How close can you get to the water’s edge before being taken by a crocodile? Unless you can tell the future you don’t know. There are no fundamental limits. It’s not black and white. Just a continuous spectrum of shades of grey. Either you or some other authority decides on an amount, limit, specification or rating but it’s simply a point on a continuous curve.
Checkout outbackjoe on facebook
See also:
Disconnect Negative Terminal when Welding
Why No Diesel Performance Chip?
How Often Should I Service My Car?
Exhaust Pipes: Is Bigger Better?


I compliment you on your article . Very interesting and should put a few of those snake oil salesman back a square or two , if they understand the science of the article . Well done .
Thanks Gary for your positive feedback. Glad the article was interesting.
This is really great article for me! I work in Manufacturing plant focus on equipment maintenance and this expand my understanding on reliability… Many Thanks!
Yo Louie glad the article was helpful, thanks for commenting.
What about parallel vs series systems? Which one is an engine? ‘Failure ‘ does NOT work as simply as you’ve attempted to explain here. Here you go… http://www.gatewaycoalition.org/files/Enggstats/htmls/Ch4.pdf – do some research.
Thanks Peter well done on reciting some words from a book yes this article doesn’t replace a book on statistics and reliability. Nor does it replace a 4 year engineering degree. You’re a freakin genius! Well done, great contribution. I guess a book doesn’t replace an engineering degree either.
Joe, Your articles are a joy to read – accessible, succinct, and most importantly they successfully navigate the ground between oversimplification and unnecessary overcomplication – the traps that others drift towards because of their innate predilections. I’ve also appreciated the diplomacy you’ve offered to those who fall into these traps, even where this respect has failed to have been offered to you.
I came here to read about dual batteries systems, and had read many pages, including this engaging refresher on some engineering principles and probability theory. I look forward to finding a similar one on risk management in the future – something I’m sure that you are skilled in!
Thank you.
Hey Simon yeah I try to avoid technical mumbo jumbo or equations but also ensure there’s enough detail to get the concepts correct. It’s good to know some people get it, thanks for your kind feedback.
And anyone who disagrees? Even if they have an engineering degree (or higher) you abuse them. Nice Joe. With that attitude, you’re obviously not sure about your facts or theories.
Hey Jim no one has disagreed about how failure works. What you on about? You talking about the chip article? There’s no engineers who disagree with that, only people with dumbass arguments that have been invalidated a million times yet they still repeat them.
Who’s got higher than an engineering degree? Are you making shit up?
Hi Joe, I’m an professional engineer, and thanks to your articles I can make an informed decision about purchasing a chip. I commend you for the way you stand up to folks who disagree with your explanations which are founded on science and universal laws. Good on you. Most of us would have probably given up. Thank you very much for your time in preparing these articles and for persevering with your answers.
Hey Brian Cheers dude glad some useful info to help decide about chips.